Debugging ARM Apps with Eclipse
This page describes debugging an ARM linux application over ethernet using gdbserver on the target.
In order to debug, you need to install gdbserver on the target (the MityDSP-L138 or the MityARM-1808). If your target is on the network and has access to the web, this can be accomplished by:
root@mitydspl138> opkg update
root@mitydspl138> opkg install gdbserver
Once gdbserver has been installed, you should download your application (compiled with debug settings using the host cross tools) and launch it through the gdbserver tool:
root@mitydspl138> gdbserver :12345 ./yourapp
Here "12345" is the port number that you want the gdbserver application to listen on. At this point, you should see a response that the server is running and waiting for a connection from a remote client.
On eclipse, you will need to setup a new debug configuration. In the debug configuration dialog you'll need to perform the following steps:
- Change the debug application from "gdb" to "arm-angstrom-linux-gnueabi-gdb"
- Select the session type to be gdbserver (a remote session).
- When gdbserver is selected, an additional configuration tab should be present for "connection type". On that tab, you'll need to change the connection from serial to "TCP", set the localhost to the IP address of the target and update the port number to the one you selected when you launched the gdbserver.
- create (in your root project directory) a ".gdbinit" file according to the info shown below
Launch the debug session. If everything works, you should see a remote connection message on the target.
gdbinit settings
The following settings are needed in the .gdbinit file in order to correctly map ARM system shared libraries when remote debugging on a linux platform with the MityDSP-L138 cross tools installed.
set solib-absolute-prefix /usr/local/angstrom/arm/arm-angstrom-linux-gnueabi
set can-use-hw-watchpoints 0
If you are developing a multi-threaded application and are pestered by REALTIME signals every time you create a thread, add the following lines.
handle SIG32 nostop
handle SIG32 noprint
handle SIG32 ignore
See [[http://elinux.org/GDB]] for more examples...
GDB dependency hassles
If you receive an error while trying to execute GDB on the host side:
error while loading shared libraries: libtinfo.so.5: cannot open shared object file: No such file or directory
GDB is failing to find a library. The functionality was moved to a different library, so you need to type (on host machine):
sudo ln -s /usr/lib/libncurses.so.5 /usr/lib/libtinfo.so.5
sudo ln -s /usr/lib/libtinfo.so.5 /usr/lib/libtinfo.so
This will link to the ncurses library which contains the functionality required by GDB.
Debugging ARM Apps with Code Composer 5.x
For the most part, the above instructions are correct. There are some minor changes though.
- Debug Configuration
- Under Run->Debug Configurations. Select C/C++ Remote Application and create a new configuration
- Pick the Project, and the application within the project
- At the bottom of the Main page, pick the right launcher
- Should say "Using GDB (DSF) Manual Remote Debugging Launcher"
- If not, click on Select other... and pick the right option
- On the Debugger tab, put in the name of gdb executable on the host.
- /usr/local/angstrom/arm/bin/arm-angstrom-linux-gnueabi-gdb
- The exact pathname might be a little different depending on the toolset being used.
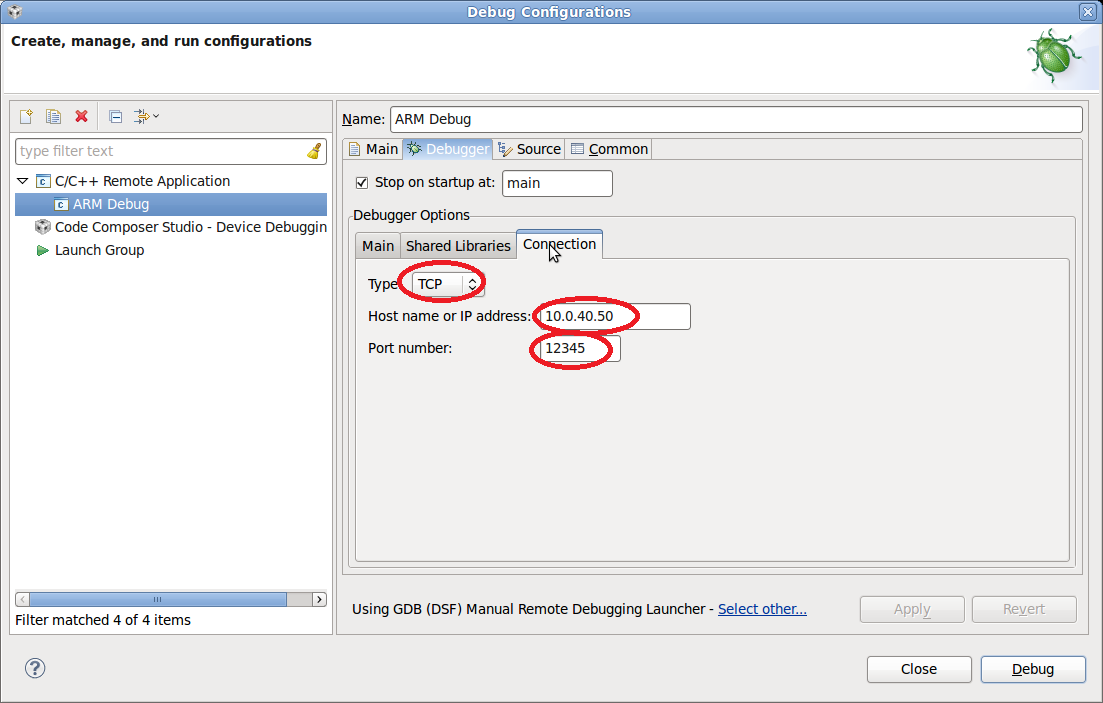
- On the Connection tab:
- Type is TCP
- IP address of the target
- Port number used when starting gdbserver. e.g. 12345
- Starting a debug session
- On target:
gdbserver :12345 ./yourApplicationName
- On host, launch a debug configuration. Run->Debug Configurations
- On target:
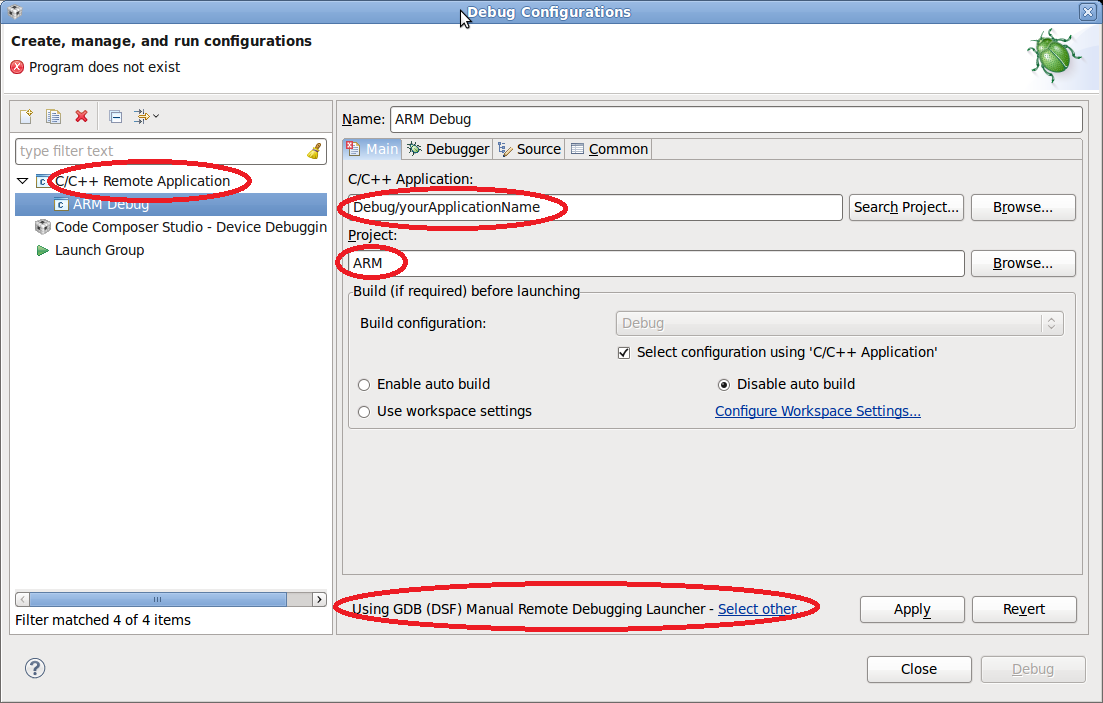
- Example Screenshots from Code Composer
- Debug Configurations
- Use C/C++ Remote Application
- Set C/C++ Application name (e.g. Debug/yourApplicationName)
- Set the Project name (e.g. ARM)
- Set the Launcher (i.e. Using GDB (DSF) Manual Remote Debugging Launcher)
- On the Debugger Tab
- Set the path name to the gdb debugger
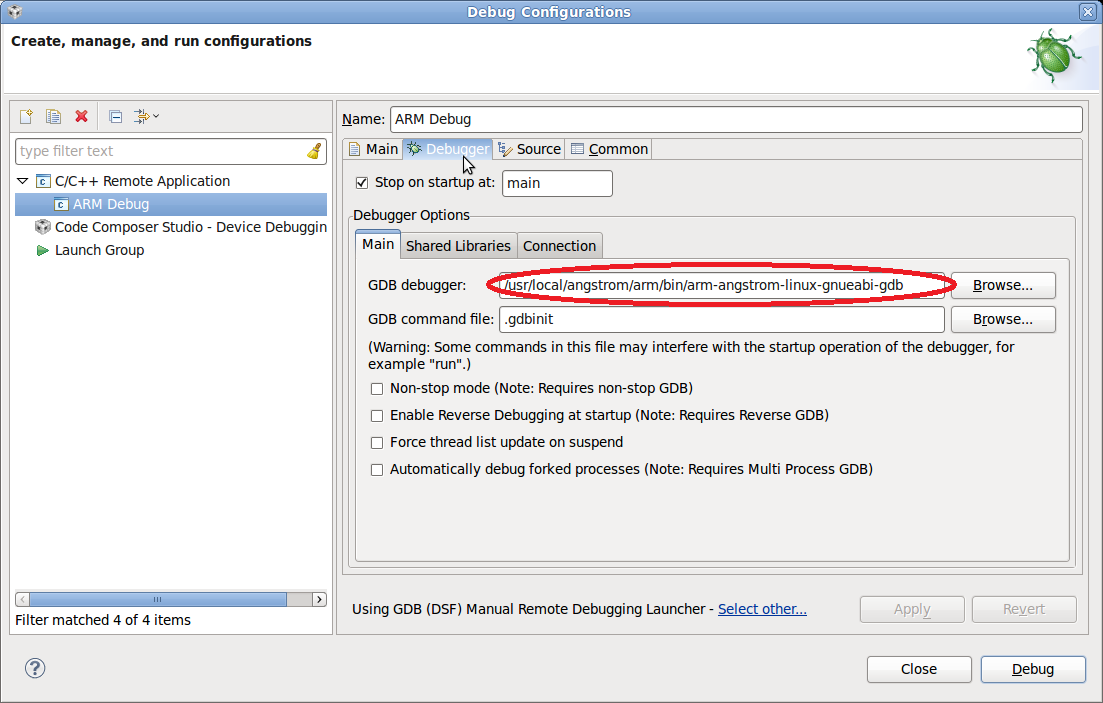
- Set the path name to the gdb debugger
- On the Connection Tab
- Set the type to TCP
- Set the Host name or IP address
- Set the port number (must match what is used on the target.
Go to top

